Classifying Administrative Divisions by Quality of Housing
The Department of Census and Statistics recently released a report
titled Classification of Administrative Divisions According to Quality
of Housing 2012, classifying the Administrative Divisions namely
District, DS Division and GN Division, according to the housing quality,
an index computed using the provisional housing data already released
from the recently concluded Census of Population and Housing.
Quality housing for good health
Housing is a basic need. Housing comprises a whole gamut of shelter
and the attendant infrastructures such as roads, electricity,
communication and transportation etc. Good-quality housing is a key
element for ensuring a healthy and productive population. Poor housing
can lead to poor health. Crowded and low quality housing conditions give
rise to poor hygiene by providing places for vermin to breed and
transmit diseases via fleas, ticks and other vectors.
 Poor household hygiene leads to food and water contamination within
the home. Poor indoor air quality leads to respiratory problems and
inadequate lighting leads to eyesight problems. Besides physical
illness, poor housing can also lead to psychological problems. Stress
and related psychological problems are higher for individuals living in
poor housing and poverty. Poor household hygiene leads to food and water contamination within
the home. Poor indoor air quality leads to respiratory problems and
inadequate lighting leads to eyesight problems. Besides physical
illness, poor housing can also lead to psychological problems. Stress
and related psychological problems are higher for individuals living in
poor housing and poverty.
Poor housing caused largely due to poverty in turn leads to poverty
not only in terms of economic deprivation but also in terms of poor
health and social ill being. Therefore, it is important to assess the
quality of housing in a country to help take measures to improve its
quality to standards that are necessary and affordable in the national
context. .
For purposes of designing interventions, it is essential to have
assessments at small area level.
This publication presents the results of a special study undertaken
by the Department of Census and Statistics to produce estimates of
housing quality at the level of the GN division. The study takes
advantage of the availability of provisional summaries of data on
certain housing characteristics that were prepared at the time of the
data collection of the 14th Census of Population and Housing that was
conducted in March 2012. Even though the census data are not yet fully
available, this information is used to provide much needed data in
advance of the release of final census data.
Measuring quality of housing
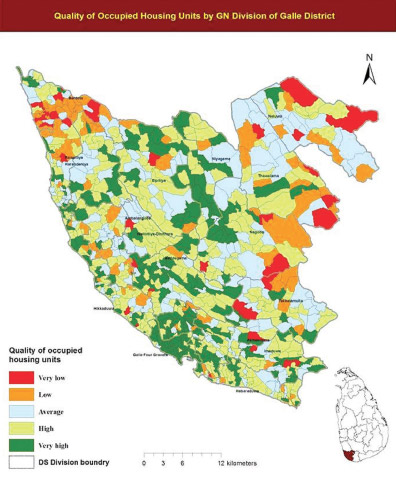
An index named Housing Quality Index (HQI) is developed to provide a
summary measure of the quality of housing. Based on the HQI, the GN
divisions are ranked into five categories: very high, high, average, low
and very low; and these are shown in maps for easy visual examination.
While there may be a consensus on an appropriate definition of basic
housing, this presumption may not hold sway for poverty. Poverty can be
defined or viewed from various perspectives such as income levels and
wages, social welfare, assets, access to basic infrastructure, income
per capita or affordability. However, evidence shows that there is a
direct correlation between housing and poverty. The quality of housing
and the standard of living or poverty are covertly or directly
proportionate.
Poverty is defined as a multidimensional issue, characterized by the
lack of, or limited income and is commonly associated with multiple
forms of deprivation and consequences caused by inability to purchase
basic goods and necessities. Poverty occurs mainly at the individual or
household level but, the most visible evidence of poverty arises when
poor families and individuals cluster in an area.
These areas which are challenged economically and disproportionately
bear the social and economic burden of unemployment, crime, deteriorated
housing, and poor health. Accordingly, the need to provide adequate,
suitable and equitable housing has remained a major priority of the
government. Adequate housing is one of the effective means to alleviate
poverty because shelter is usually the most expensive item for
households. It is also a pre- requisite for better health, providing a
great amount of saving when one is not sick.
Under these circumstances, in order to make informed decisions and to
make effectively targeted interventions on improving the quality of
housing, statistics on quality of housing for small population groups or
communities living in poor quality housing is required. Statistics on
conditions of housing are compiled through surveys and Population and
Housing censuses. But survey data can be used to compile these
statistics at district level only. Population and Housing censuses yield
such data down to the level of GN division.
Population and Housing Census
Census of Population and Housing is the largest statistical
undertaking in a country. A population census is the only source that
provides reliable and detailed statistics on the size, distribution and
the composition of population and housing of a country. The 14th Census
of Population and Housing of Sri Lanka was conducted in March 2012.
The enumeration stage of the Census was carried out in February?March
2012. Information collected at this Census is of utmost importance to
Sri Lanka since this Census covered the entire country after a lapse of
30 years. As stated earlier, this study was undertaken to develop an
indicator called Housing Quality Index to measure quality of occupied
housing units, at the smallest administrative level of GN division using
housing data that have been already released using statistical tools.
Percentage of occupied housing units for which principal source of
lighting is either the National Grid or a rural power projects,
Percentage of occupied housing units having toilets for exclusive use,
Percentage of occupied housing units of which permanent materials:
bricks, cement blocks/stones or cabook have been used for the
construction of walls, Percentage of occupied housing units for which
permanent materials: tiles, asbestos, concrete, zink aluminium sheets or
metal sheets, have been used for the construction of roofs, Percentage
of occupied housing units which are not raw houses, line houses,
shanties or other types are the indicators used to compile the Housing
Quality Index. This report provides maps depicting the spatial
distribution of quality of housing across administrative divisions of
District, DS and GN to facilitate more user-friendly use of the
information.
Natural Break method
In grouping each administrative division, into five classes a
statistical tool called Natural Break method was applied. Those classes
were labeled as Very high, High, Average, Low, Very Low.
This method identifies break points by looking for groupings and
patterns inherent in the data. The administrative divisions are divided
into classes whose boundaries are set where there are relatively big
jumps in the HQI data values by which within class variation is
minimized.
This ensures administrative divisions in each group are homogeneous
with respect to the values of HQI. This classification was carried out
at the GN division level of each district separately so that within
district variation of HQI can be compared across GN divisions. Using the
average values of HQI, DS divisions and Districts were also classified.
No of DS divisions and No of GN divisions falling into housing qualities
of Very High, high, average, low and very low by district are shown in
the table.
To facilitate the comparison of spatial patterns, standard color-
codings were used in preparing maps. In the same way maps are prepared
for the five indicators selected for the study as well. Evidence of
validity of this measure were found from field visits.
As stated above, this study provides an index on housing quality HQI
which can be considered as a proxy measure of poverty levels at GN, DS
and district levels.
For poverty reduction and equity focused development programmes it is
essential to reach the most marginalized. However, these small area
statistics on poverty are hard to obtain for reasons of practicality and
cost. Lack of poverty data for small areas is a conspicuous and often
spoken about gap in our knowledge base.
It has been shown that there is a positive correlation between
poverty and quality of housing. In the absence of poverty measures at GN
level, HQI can provide a proxy measure of poverty which could capture at
least some dimensions of poverty. Therefore, HQI can be used to identify
small areas at low quality housing units which can correspond with high
levels of poverty.
In the report: Classification of Administrative Divisions by Quality
of Housing: 2012, spatial variation of HQI and other indicators used for
this study have been presented in maps for easy visual examination of
housing quality across administrative divisions: District, DS division
and GN Divisions together with statistical data tables.
Dr. Amara Satharasinghe,
Additional Director General Department of Census and Statistics
|


")
