2008: good year for tea producers
Auction Performance - High and Mid
Grown Teas
In Sri Lanka at the Colombo Tea auctions, the market for High grown
teas in Q1 continued at high levels achieve in December 2007. By
February the elevational average had reached an all time high of Rs.
318.04 per kilogram (US$2.98).
Sri Lanka benefited from the Kenyan fall out and also had extra
demand during the Western Quality season. Mid season rains boosted
production and increased auction quantities and with Kenya gradually
resolving its issues there was a noticeable slackening of demand
thereafter. March average declined 5% to Rs. 302.51 per Kg (US$ 2.83).
This trend continued during the cropping months of April and may when
High Grown averages bottomed out at Rs. 253.23 (US$ 2.37), June is a low
month in most years, but with global shelf prices rising following the
commodity boom, prices revived rapidly and High Growns reached Rs.
268.55 (US$ 2.51).
The 6% increase took place at the height of summer before the normal
pre-winter buying revival late in July. During the price boom for
orthodox leafy tea many High grown estates, particularly those on the
Eastern Slopes of the island and a substantial proportion of the Mid
Growns made leafy teas.
Even some of the estates marking small leaf grades produced 3% - 5%
of speciality semi leaf types that sold at high value in sympathy with
the leaf tea market.
Supply of small leaf grades was restricted therefore; and with the
Eastern Quality season playing its part the elevational average for Q3
peaked at Rs. 291.37 (US$ 2.72) in September.
Q4 started weaker and by November the high grown average had crashed
to Rs.230.36 per Kg (US$ 2.11), the lowest level since June 2007.
December was worse and the average dropped 12% to Rs. 201.27 (US$ 1.84).
In SL Rupees and US$ this was the lowest monthly average since November
2006.
Mid Growns from both the Eastern and Western slopes of the Island
have tended to be flexible with their grade mix.
The RPCs have the choice of moving leaf to factories that will
optimise returns on prevailing market conditions. Many regional clusters
of estates boast factories of Orthodox leaf tea. CTC and Orthodox
Rotovian manufacturing capacity. In Q1 leaf moved to factories to take
advantage of the strong market for small leaf High Growns, whilst others
continued with orthodox leafy tea grade mix.
Mid Grown average which opened the year at Rs. 298.90 per Kg (US$
2.79) in January and was well below the High Grown figure of Rs. 316.88
(US$ 2.96) By March Mediums has risen to a record Rs. 303.63 (US$ 2.84)
per Kg with the High Grown average down to Rs. 302.51 per Kg (US$ 2.83).
This trend continued in Q2 with the leafy teas selling in sympathy
with Low Growns, at a premium over High. Q3 levels were steady with
small leaf doing well. leafy standards started to decline following the
general trend but averages held in September. Q4 followed the national
trend and the December average was Rs. 182.12 per Kg (US$ 1.66), 39%
below the years opening rates. The other aspect was the high percentage
of unsold teas in Q4 that were not reflected in the averages.
Auction Performance - Low Growns
A simple-comparison of oil prices and the market for Low Grown teas
does show a positive co-relation. But how does this translate to
consumer behaviour? Many of these nations increase social spending,
infrastructure development and attract migrant workers who grow their
populations.
These workers also contribute to development and increased
consumption in their countries of origin, through remittances home. Sri
Lanka’s unique range of Orthodox leafy grades enjoy a significant niche
of premium price in a globally commoditized market driven by CTC teas.
 It
also true that new entrants from India and to lesser extent Vietnam are
taking share in this tea for price segment, dependent on the market for
Sri Lanka’s prime Low Grown Orthodox tea. It
also true that new entrants from India and to lesser extent Vietnam are
taking share in this tea for price segment, dependent on the market for
Sri Lanka’s prime Low Grown Orthodox tea.
Oil revenue driven economies in the Middle-East, North Africa and to
a lesser extent Russia / CIS, largely consume Orthodox Ceylon Black,
tea. Rising oil revenues, increased private sector activity and
liberalisation of previously controlled markets increase consumer
choice.
With these changes grew a preference for superior Ceylon Tea. Revival
of demand in Iraq is a case in point. Iran and Libya are examples of
markets that opened up. This meant, there was more demand being created
at the Colombo Tea Auction on top of the positive sentiment of a bullish
global commodities market, that had shelf prices rising in most
countries.
In Sri Lanka high margins that were being made at factory level were
ploughed back and fuelled strong demand for green leaf by bought leaf
factories, looking to maximize production capacities. The unhealthy
competition for green leaf caused standards to drop with consequential
adverse effects on made tea. Secondary grade production kept increasing
and by June, problems with a key market caused less to be unsold.
With low value grades unsold and loosing heavily in price the total
average of factories were artificially high and with it the elevation
average. Factories were loosing money without realizing it, as they paid
artificially high green leaf rates. Small Holders were pampered and
demand high prices for an ever declining quality of leaf.
It was in Q4 2007 that the market for Low growns really strengthened
and continued through Q1 2008. By May prices started rising and with
seasonal buying being resumed, Q3 got off to a record breaking start
when July average reached a record Rs. 391.27 (US$ 3.65). By August
cracks in the market began to appear and prices eased. In September the
slide continued and some categories of tea were difficult of sale. Q4
saw the market crash, factories defaulted on green leaf payments and
production slumped.
The Crunch
Overheated commodity prices started sliding earlier in the year, but
the impact on tea was felt at its most during Q4 2008. The global
financial crisis caused panic uncertainity and negative sentiment in the
tea trade of the world.
October and November were the worst periods when large quantities
remained unsold and prices crashed. Uniqueness of Orthodox Ceylon tea
market, high inventories of value add tea stock, and exceptional
strength of the Sri Lanka Rupee on top of the Global financial crisis;
caused Low grown teas to loose out the most.
The Low Country auction average which peaked at Rs. 391.27 (US$ 3.65)
in July crashed to Rs. 223.78 (US$ 2.05) (-42%) by December. Unsold
quantities were rising continually and were at the highest at Auction of
22nd October, when the Small Leaf Catalogue had 58% and leafy 40%
unsold. The Government intervened through the Sri Lanka Tea Board and
took the unprecedented step of buying at the Auctions the following
week, and absorbed about 900,000 kilograms of tea.
This had a stabilizing effect on the market and buyers who were
waiting for further price drops resumed purchases. Since then the unsold
quantity declined continually, with the exception of the mid November
period.
Higher elevation small leaf teas started easing in value only in
October when the High Grown Auction Average dropped from Rs. 291.27 (US$
2.72) In September to Rs. 261.18 (US$ 2.43). By November it was Rs.
230.36 (US$ 2.11) and a very low Rs. 209.97 (US$ 1.91) In December.
Unsold quantities however were not as high as Low Grown Teas.
Higher elevation teas had to also contend with high supply from
Africa and a market collapse at the Mombassa auction, following the
Pakistan currency crisis, that resulted in a large volume of low value
tea being available on the world market.
Losses to Estates, Small Holder, Factories, exporters and Brokers
will take time to be recovered and some may not survive. The consumer
however categorized tea as an essential food item and continued to
consume this beverage during the coldest period of the year.
The challenge was for companies starved of credit with critical cash
flows and incurring losses on currencies; to walt out the storm. By late
December there were signs of recovery as more cash began to enter the
system and inventories were run down. Colombo had only three auctions in
the month and private Sales had been stopped. The pent-up demand was
held ready to be released in January 2009. The market responded as
expected but has some way to go before stabilizing.
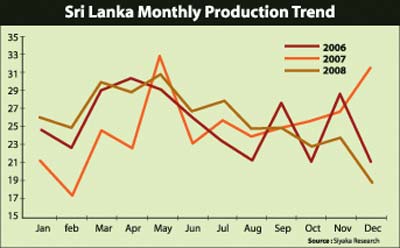
Record Tea Production in 2008
Sri Lanka tea production of 318.4 Mnkg in 2008 is the highest in the
history of the tea industry. The previous record was 314.8 set in 2005.
The ‘08 figure is 3.3% more than the ‘07 total of 307.7 Mnkg. The Sri
Lanka Tea Board reviewed its procedures in July 2008 and amended
previously published monthly figures for the first half of the year. The
amended monthly totals are yet to be published, and the monthly figures
do not add up.
Some of the gloss of the annual record achieved was lost when
December slumped to a fourteen year low of 19.1 Mnkg. 1994 was an
election year and December was one of the lowest performing months. In
December 2008 growing areas worst hit were the Mid and the Low country
dominated by smallholders.
Dry weather, non application of fertilizer, pruning of bushes due to
market collapse, delayed and or non receipt of green leaf payments from
factories resulting some smallholders inability to pay tea pluckers were
some of the main reasons that caused production to crash. In spite of
some recovery in the market, these factors will continue to impact
negatively on tea production in Q1 2009 and could extend to early Q2.
The 2008 record was made possibly by the Low Grown sector which
produced a highest ever 185.2 Mnkg, an increase of 2% on the ‘07
quantity of 181.8 Mnkg. Previous record for the elevation was 184.5 Mnkg
achieved in 2006. High Growns at 84 Mnkg increased 13% on the 2007
quantity of 74.3 Mnkg. Q1 ‘07 was a bad period for the elevation as a Q4
‘06 strike compelled over grown bushes to be pruned. 2008 High Grown
production of 84.2 Mnkg is the highest since the 2002 crop of 86.9 Mnkg.
Mid Growns declined 5% from 51.5 Mnkg to 48.9 Mnkg in 2008.
Considering that both High and Low Growns achieved a higher crop, it
seems that some Mid Grown smallholder leaf would have been transferred
to bordering factories who’s prices were much higher.
Further, analysis of the elevations shows that Low Growns accounted
for 57% of national production. Within this segment Ruhuna had a share
of 34% whilst Sabaragamuwa was 23%. Within Ruhuna, Galle 50.7 Mnkg
immerged as the prime sub district followed by Deniyaya 16.5 and Matara
16 Mnkg. In Sabaragamuwa, Ratnapura was 50.2 Mnkg and Balangoda/Rakwana
9.9 were the main sub districts.
High Growns which accounted for 28% of national production had the
Western sub category producing 16% of the national harvest whilst Uva
was 8% and Udapussellawa, Nuwara Eliya contributed 2% each.
The Main sub districts were
Nanuoya/Lindula/Talawakelle 8.9 Mn and Upcot Maskeliya 8.4 Mn. In the
Medium category Western was 12% and Uva 3%.
Production Outlook
Since 2001 Sri Lanka has consistently achieved annual production in
excess of 300 Mnkg. In the past four years tea production has been 310
Mnkg and above, with the exception of 304 Mnkg in 2007. In that year,
post ‘06 strike issues for High Growns and adverse weather in the Low
Country reduced the national crop figure. Sri Lanka is heading for a
very poor Q1 in 2009 and will be hard pressed to achieve the 2007 figure
of 304 Mnkg.
Sri Lanka Tea Exports 2008
Sri Lanka Tea Exports do well in a
difficult year
Sri Lanka shipped 319.7 Mnkg in 2008, a volume second only to the
record 327.4 Mnkg shipped in 2006. The country exported 311.7 Mnkg in
2007. Value of exports however is a record Rs. 137.6 bln (+21%) compared
with a previous high of Rs. 113.5 bln earned in 2007. In US dollars the
export value is $ 1.27 bln higher than the landmark figure of $1 bln
earned in 2007. In 2006 the record quantity generated earnings of
Approx. US$ 880 million. Considering the disastrous fourth quarter of
2008 following the global credit crisis, it is unlikely that the country
would have received full proceeds as declared in the shipment data.
Our estimate of Dollar earnings are based on approximate conversion
of declared Rupee figures. During the period September to December 2008
and even in January 2009 many of our key tea importing country’s
currencies declined sharply in value against the Rupee. Further, many
shippers were compelled to renegotiate or refund agreed values following
the market crash and some are yet to receive proceeds from customers who
have changed settlement terms.
These factors should not however detract from the outstanding
performance of the export sector, that traded under difficult and often
volatile conditions, which had Colombo auction prices rising, and
importing country obstacles that had to be overcome as well. This would
have significantly eroded tea exporters rupee earnings when proceeds
were realized.
Russia/CIS has emerged once again as the prime destination for export
of Ceylon Tea with a quantity of 68.8 Mnkg. This cluster of countries
accounted for 22% of all Sri Lanka’s exports. In 2007 a total 70.5 (23%)
was shipped direct to this market. The UAE, a key reshipment centre
handled 45.4 Mnkg up from 44.1 Mnkg a year ago. Iran was steady at 32
Mnkg (10%). Syria was marginally lower at 26.4 Mnkg than 27.6 Mnkg in
2007.
Japan the important high value buyer of brighter High Growns has
fully maintained quantities at 10.7 Mnkg.
Kuwait had recorded exceptional gains from 2.9 to 7.9 Mnkg in 2008.
Saudi Arabia has disappointed with a 16% drop from 8.5 in ‘07 to 7.1 in
2008. The underperformance of this market could have long term
implications for Low Grown teas with producers already looking to
alternate standards that would reduce dependence on demand from Saudi
Arabia. Chile the only significant South American market for Ceylon Tea
increased its off take by 8% to 6.9 Mnkg.
Germany had grown 10% to 6.3 Mnkg with Hong Kong steady at 4.9 Mnkg.
Tunisia however has declined 15% from 5.5 in ‘07 to 4.7 in 2008. The
Netherlands follows steady at 4.6 Mnkg. Finland a gateway Russia has
declined sharply from 6.4 to 3.7 Mnkg. Australia the second most
important market for Tea Bags, is nominally ahead with absorption of 3.2
Mnkg.
Major producer Exporter Countries
Comparative performance
In 2002 Kenya exported 383 Mnkg at a unit value of USD 2.34. Sri
Lanka achieved an approximate FOB value of USD 3.97 (+69%) on a quantity
of 319.7 Mnkg. Today Kenyan earnings is around 896 million dollars
against 1.2 bln by Sri Lanka. Meanwhile India upped exports 10% to 196
Mnkg from 178 Mnkg in ‘07. China export figures should exceed 300 Mnkg
for the first time in its history. Approximately 78% of all exports are
Green Tea and about 19% Black Tea. Indonesian figures are projected at
90-95 Mnkg approx. 13% of which is Green Tea.
(All details extracted from Asia Siyaka Commodities (Pvt) Ltd.,
Annual Report 2008 and Outlook 2009) |