|
DAILY NEWS ONLINE |
|
|
|
OTHER EDITIONS |
|
|
|
|
|
|
|
|
|
OTHER LINKS |
|
|
|
|
|
|
  |
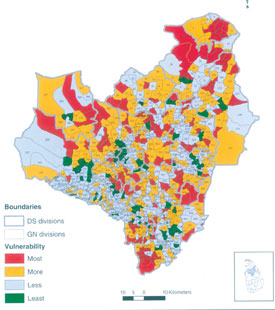
Anuradhapura's food insecure areasFinding ways to reduce poverty and inequity is a daunting challenge for local, national, and international decision-makers. One important aspect of the challenge to reduce poverty and inequity is that poor people tend to be clustered in specific places. Aggregated, national-level poverty data mask this sub national variation. Poverty maps can help uncover poor areas that might otherwise go undetected.
Poverty mapping, the spatial representation of poverty, is becoming an increasingly important instrument to identify areas where development lags and where investments, infrastructure and services could have the greatest impact. According to the official statistics, 23 per cent of the population of Sri Lanka is poor. Therefore, eradication of poverty has been given a high priority in the agenda of the Sri Lanka Government. Several government and, local and international non-governmental organisations are implementing various projects aiming at development and poverty eradication. Food insecurity is strongly linked with poverty. Food insecurity is defined as the limited or uncertain availability of nutritionally adequate and safe foods or limited or uncertain ability to acquire acceptable foods in socially acceptable ways. Food insecurity is a spatial phenomenon, and varies considerably across geographical areas. A Divisional Secretary (DS) division is quite a large area and therefore, there can be a wide variation in levels of food insecurity within DS divisions. Therefore, for more efficient targeting it is necessary to identify poor/food insecure areas at lower administrative units so that level of food insecurity within such units can be considered homogeneous. Due to the lack of secondary data, preparation of poverty/food insecurity maps at lower level administrative units is not possible. The Department of Census and Statistics in collaboration with the United Nations World Food Program, recently conducted a study to make an attempt to explore the possibility of devising an alternative method to obtain data required for classification of lower level administrative units according to poverty/food insecurity. In this study, a Knowledge Based Scoring method was adopted to obtain the necessary data required for the classification at Grama Niladhari (GN) division level. Grama Niladharis were trained and instructed to assign scores to a set of indicators related to poverty/food insecurity based on their experience and knowledge gained, by working long periods of time in their respective areas (GN Division). In addition to these selected indicators, some indicators at GN division level that have been released, based on the data collected from the Census of Population and Housing (2001) were also used in this study. Altogether 22 indicators; 14 from KBS method, 8 from Census of Population and Housing - 2001, capable of capturing variation in food insecurity were used in this study. Statistically, these 22 indicators were reduced to an index known as Vulnerability to Food Insecurity while retaining most of the important characteristics of the original indicators. There are 694 GN divisions in the Anuradhapura district. Statistically, these 694 GN divisions of the Anuradhapura district were classified into 4 groups using the scores of this index. The GN divisions falling into the first group were called most vulnerable to food insecurity. GN divisions falling into 2nd, 3rd and 4th groups were labelled as more, less and least vulnerable to food insecurity. For easy reference, this classification was displayed in a map of GN divisions of the Anuradhapura district. GN divisions classified as most vulnerable and more vulnerable were shaded in red and orange colours respectively. Yellow and green were the colours used to shade GN divisions falling into less and least vulnerable to food insecurity. Field verifications and comparison of classification against infrastructure facilities of GN divisions indicated the high reliability of the findings of this study. This study has been carried out for Badulla and Monaragala districts as well. These maps can have a substantial impact on decision-making by improving and validating geographic targeting of poor areas; making resource allocation more accountable, transparent, and equitable; igniting national and local-level debate and awareness on poverty; encouraging broader participation; facilitating coordination between and within institutions; and improving the credibility of institutions. Monitoring is an important component of any project. The maps so compiled can be used to monitor the impact of interventions implemented within GN divisions. Repeating this study preferably at two-year intervals and observing the shifts in levels of vulnerability of GN divisions to poverty/food insecurity, impact of interventions could be assessed. |


|
|